We built the best machine learning model for trading cards in the world. Here are the numbers.
Vardera identifies trading cards with 96% accuracy and grades them within one grade point 99% of the time, in under a second. Frontier AI models aren't close — and the data shows why they can't be.

Written by
Ben Parfitt, Chief AI Officer

Vardera builds computer-vision infrastructure for collectibles and condition-dependent goods. Earlier this year we published benchmark results for our coin identification and grading model, tested head-to-head against the most capable frontier AI models in the world. This is the second post in that series: trading cards.
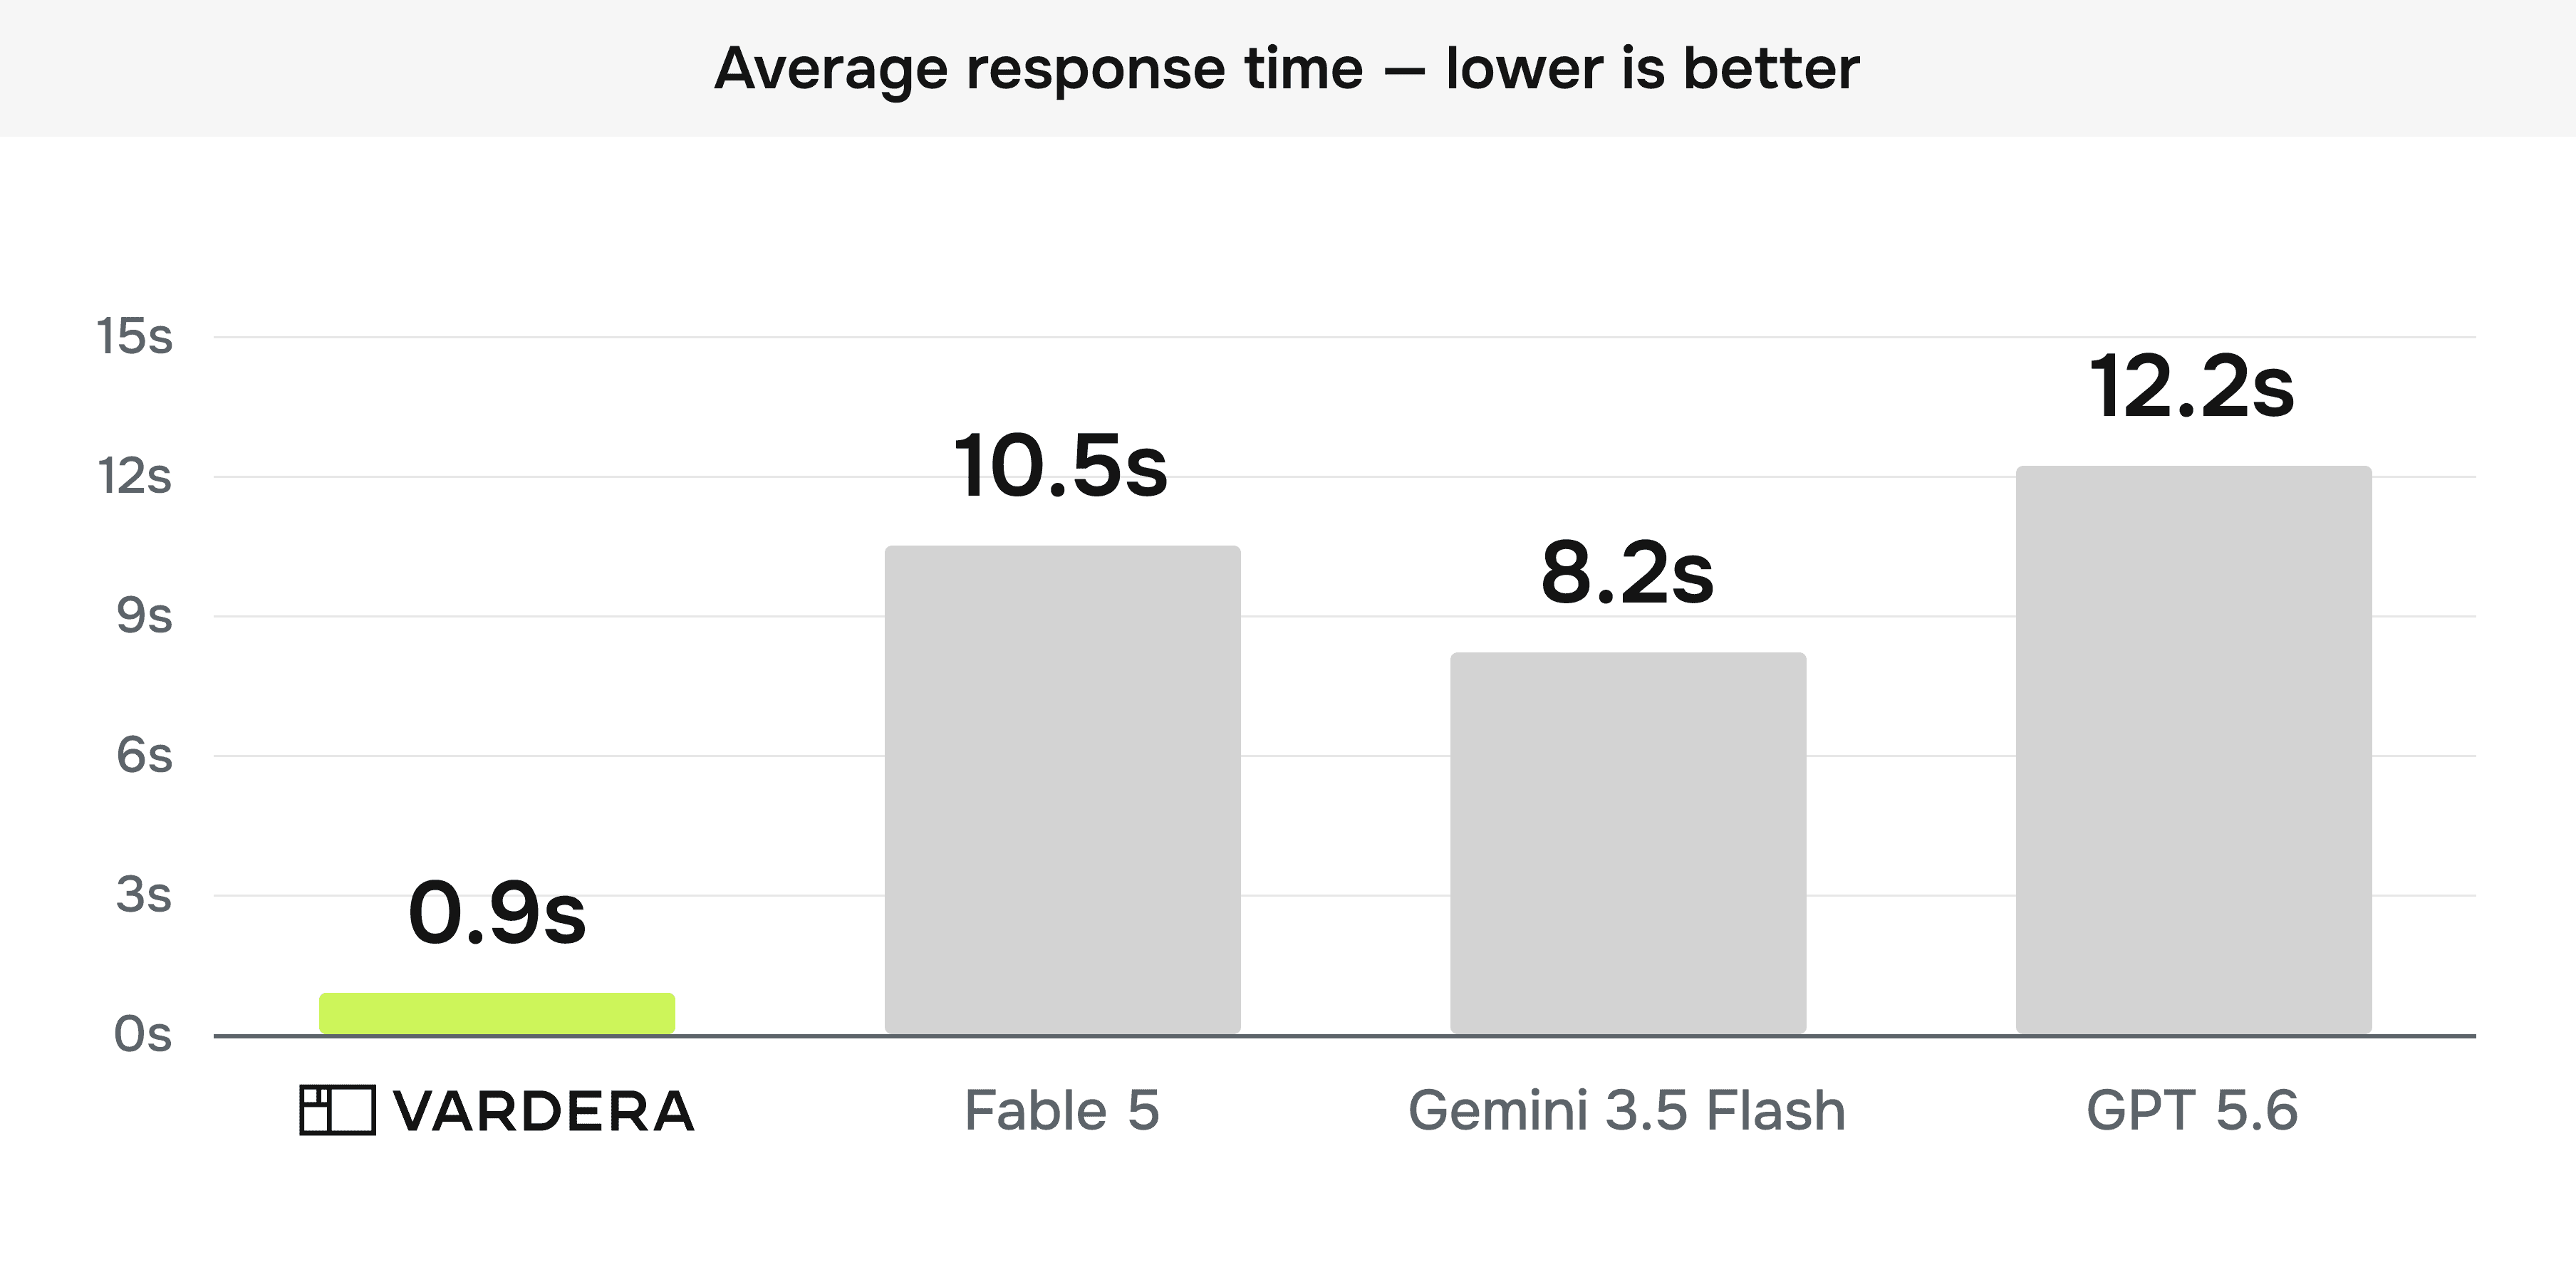
Vardera identifies trading cards with 96% accuracy and grades them within one grade point 99% of the time, in under a second. The best frontier model manages 64.9% on identification and 69.4% on grading, and takes nine to fourteen times longer to answer.
The pattern underneath every table in this post is the same. Frontier models guess — and in some cases they guess quite well. Vardera knows. This post presents the full benchmark data and explains the difference.
Frontier AI reads cards. It doesn't recognize them.
Ask a frontier multimodal model what's in a photo of a trading card and it will read the player's name off the front almost every time — about 97% in our testing. These models are excellent at OCR.
But a card's name is not its identity. A card's identity is the combination of name, set, year, card number, and parallel — and the parallel is where the money lives. A base rookie card and its serial-numbered parallel can differ in value by four orders of magnitude, and the only visual difference may be a foil pattern and a stamp.
Each field is a little harder than the last: roughly 97% on name, low 90s on set and year, high 80s on card number, and a ten-point drop on parallel. Because a card's identity requires all five fields at once, those per-field error rates compound — multiply them through and the best frontier model composes a fully correct identity only 65% of the time. On cards with multiple parallel variants, the case that determines real-world value, parallel accuracy drops another 10 to 15 points. That is what guessing looks like: individually plausible answers whose errors multiply into an unusable whole.
This is not a prompting problem or a model-size problem. General-purpose models optimize for breadth across millions of tasks. Card identification and grading require purpose-built depth: domain-specific training data, specialized feature extraction, and models designed from the ground up for fine-grained visual discrimination.
Our approach: custom models, not LLM wrappers
Vardera trains category-specific computer vision models for each domain we cover. For trading cards, that means models trained on one of the largest databases of expert-graded card imagery ever assembled – built to identify the exact card, down to the set, number, and parallel, and grade its condition against the standards the industry already trusts.
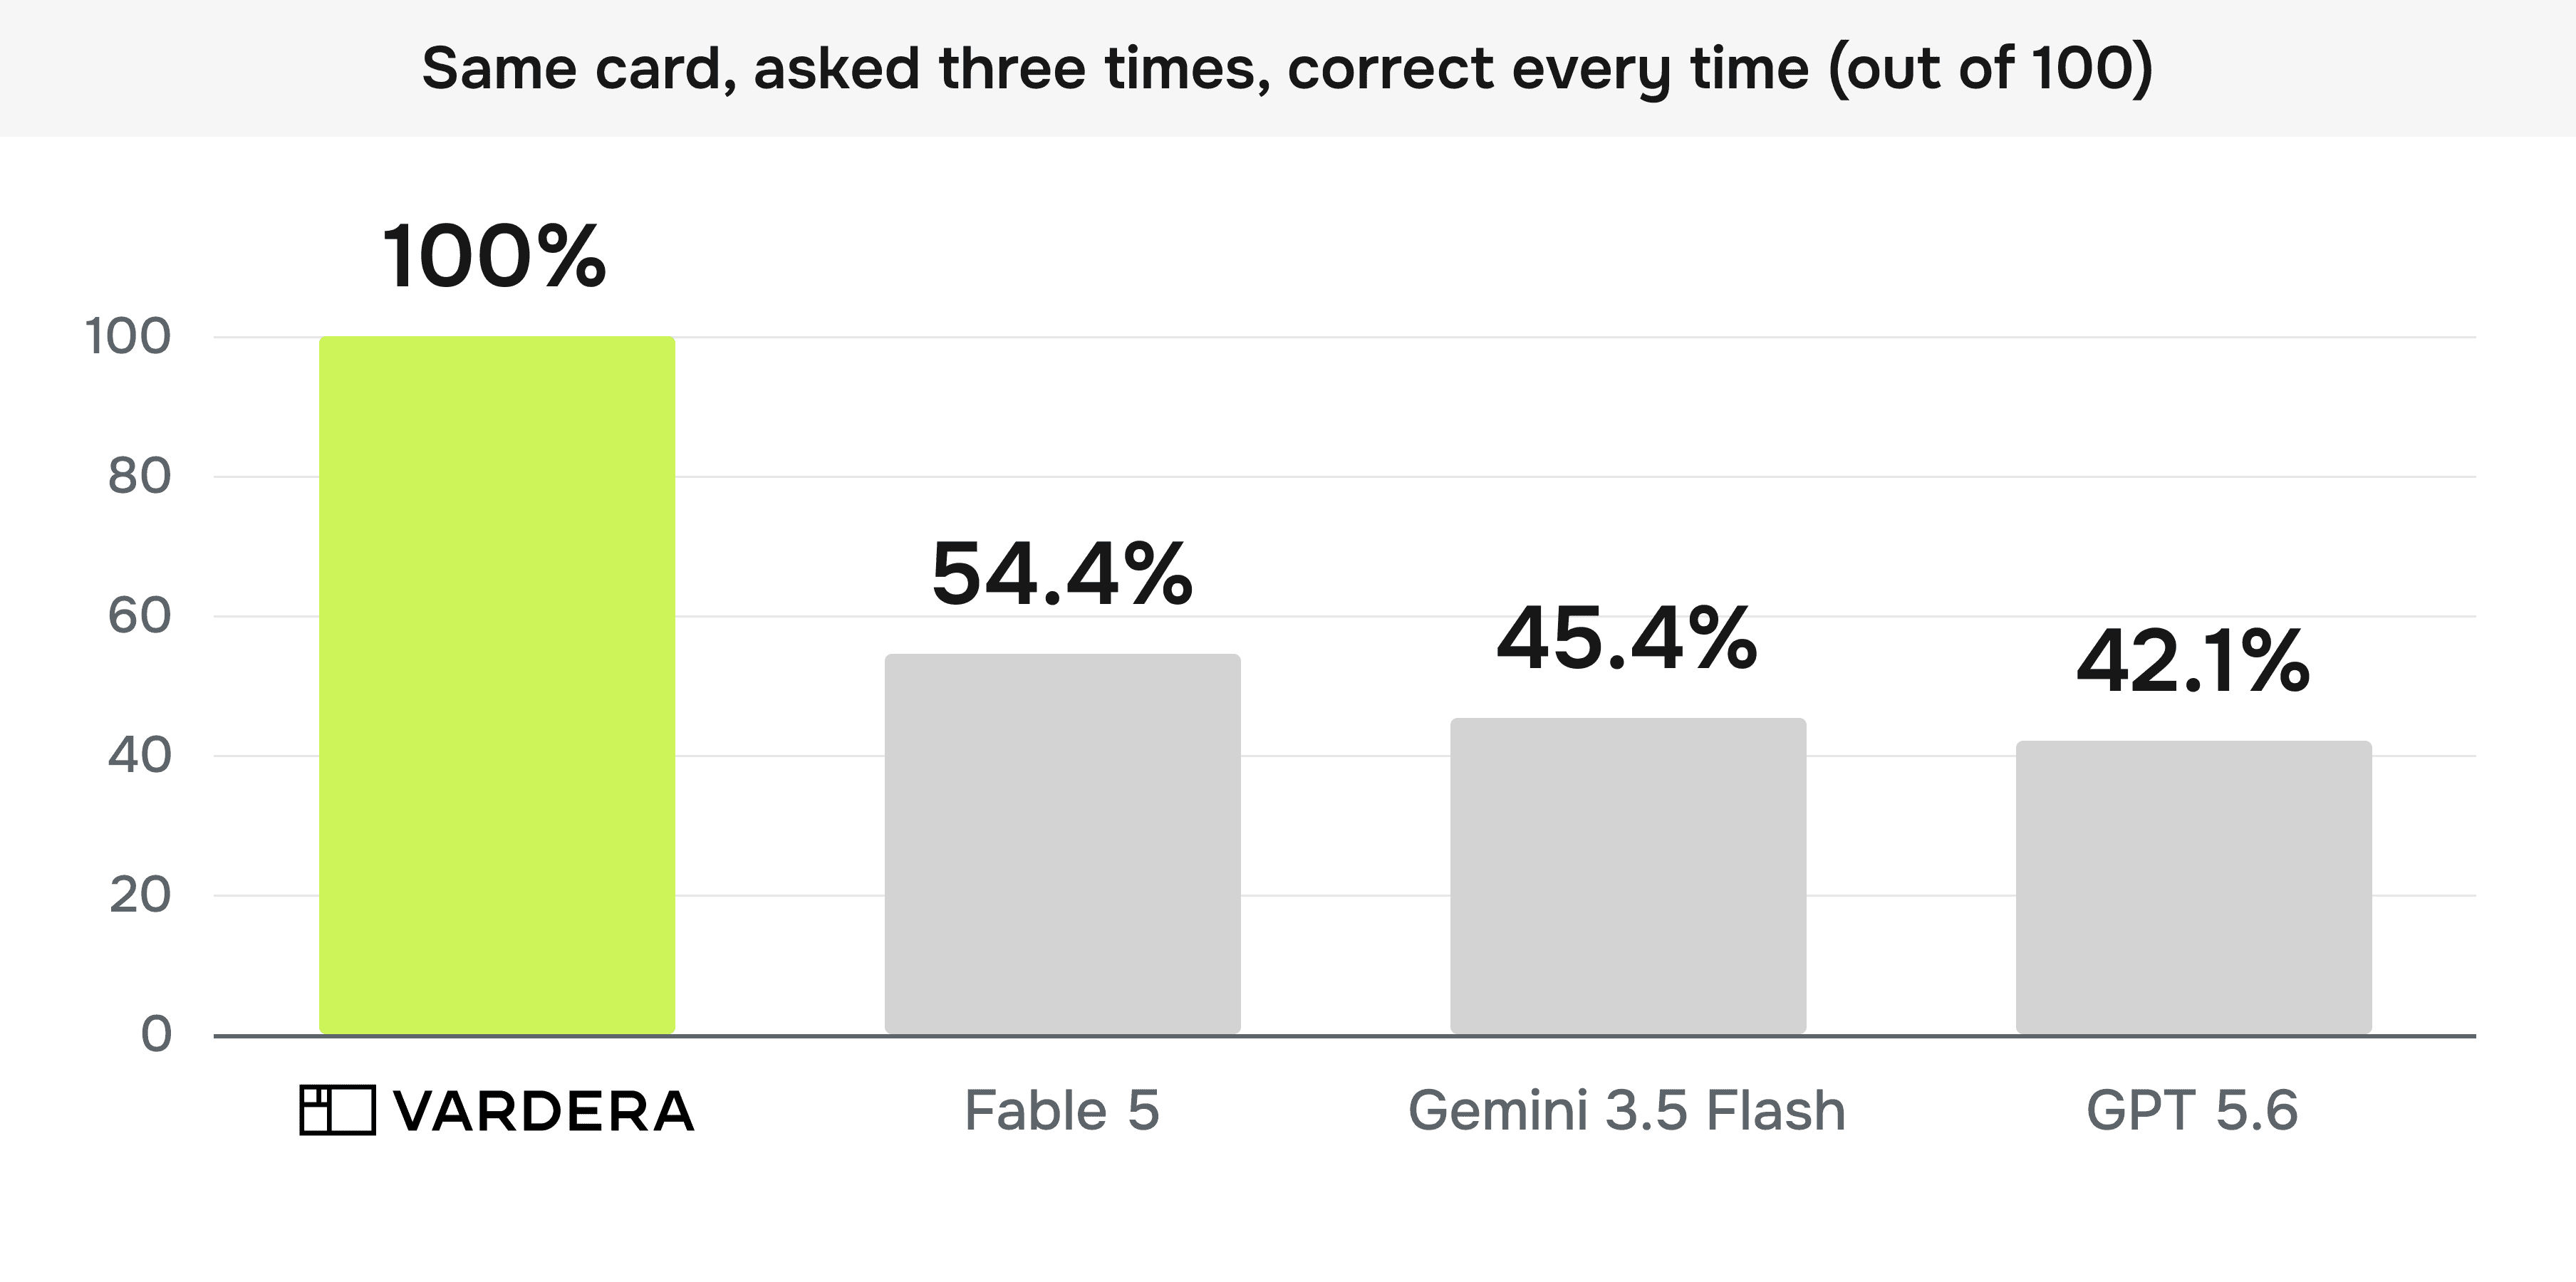
Two properties of these models matter as much as their accuracy. First, they are deterministic: ask the same question of the same card and you get the same answer — 100% of the time in this benchmark, against 42 to 54% for the frontier models. Second, they return a confidence signal. On a card the model hasn't seen — a brand-new release, a deeply niche issue — it flags low confidence rather than producing a fluent guess. A frontier model will read an unfamiliar card and confidently invent the rest of the story. In production, knowing when you don't know is worth nearly as much as knowing.
The benchmark
We evaluated Vardera against frontier AI models on a standardized test set of trading card images, measuring three things: identification accuracy, grading accuracy, and average inference time per image. Every model received the same images and the same task, scored against the same ground truth.
The test set contains 800 cards, including 469 multi-variant cards, the hard case where several visually similar parallels of the same card exist. The 800-card test set was held out of Vardera's training data. Identification requires all five identity fields correct: card name, set, year, card number, and parallel. Grading is scored against the PSA grade on the slab; a prediction counts as an error when it is more than one point off from the PSA grade. We deliberately sampled more low-grade cards than the natural population of graded cards contains, because most cards people grade are nice cards, and catching the bad ones is where grading matters. Each frontier model ran every card three times, 2,400 runs per model, to measure consistency.
We scored the frontier models generously. The judge accepts cross-field matches, so a model that gets the right information into the wrong field still counts as correct: answer "Gengar Holo" in the card name and "Base" in the set, and we take it, even though the fields are scrambled. We did that on purpose. We wanted the failures to be real failures rather than artifacts of strict string matching. The numbers below are what the models managed with the scoring tilted in their favor.
We ran this benchmark ourselves. That's why the methodology is spelled out above and why we publish the number that makes us look worst (85% on the class-balanced grading measure) right next to the one that flatters us (99%).
If you have questions or pushback, write to us at info@vardera.com — we'd love to hear from you.

Even the strongest frontier model composes a fully correct identity on only 64.9% of cards, and lands the grade within one point on 69.4%. And those numbers understate the production problem: run the same frontier model on the same card three times and the best one returns a fully correct identity all three times on only 54% of cards. Vardera returns the same answer every time.
Put those side by side and the gap is not incremental. Vardera identifies 96% of cards correctly where the best frontier model manages 64.9%, and grades 99% within a point where the best manages 69.4% — nine to twelve times fewer identification errors and thirty-one to thirty-six times fewer grading errors, at nine to fourteen times the speed.
At marketplace scale the gap stops being abstract. On a catalogue of a million listings, identification that is right 64.9% of the time leaves 350,000 items described wrong — and every one of those is a mispriced listing, a support ticket, or a dispute.
It's even harder when you can't see the whole card
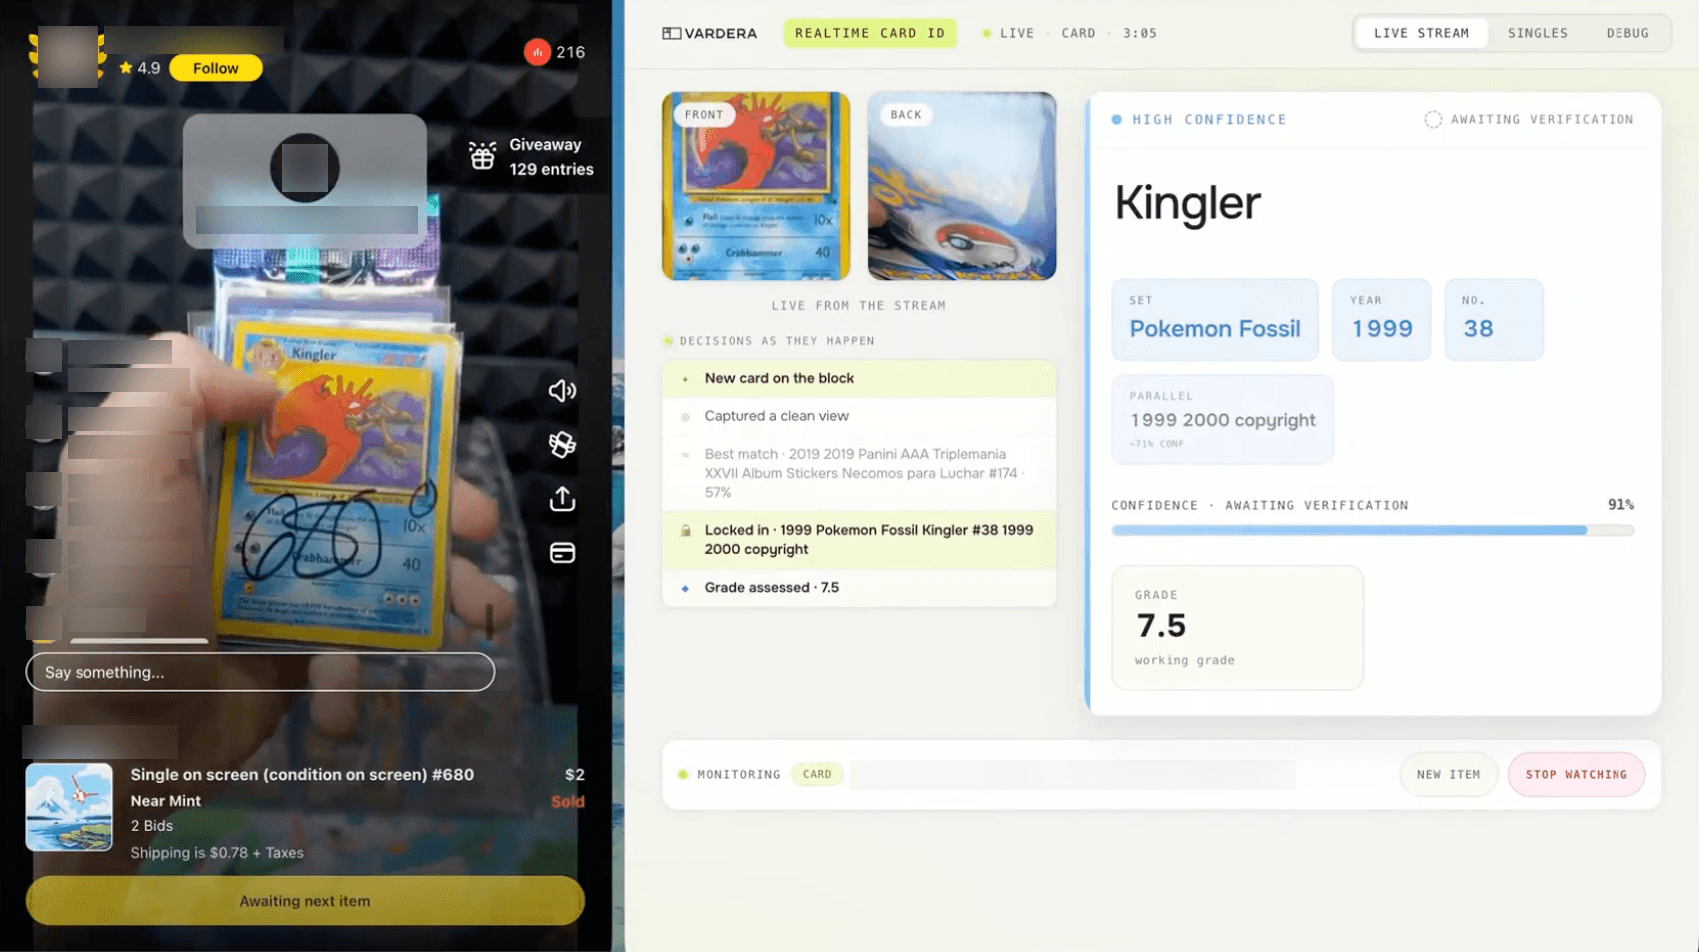
A live Whatnot auction, a portion of the card behind the seller's hand and the lot closing in seconds. Vardera reads it as a 1999 Pokémon Fossil Kingler #38 and returns a working grade of 7.5 while the card is still on screen.
Benchmark images are clean. Social commerce is not. A seller on a Whatnot live stream fans a fresh pack toward the camera and you see two-thirds of each card. A marketplace listing photographs a binder row and you see the top half. So we re-ran the identification benchmark with a random 25% of each card occluded — an easier condition than much of what live commerce actually produces.
The frontier models' identification ability was roughly cut in half. Vardera stayed in the mid-90s.¹
Model | Full ID (clean) | Full ID (25% occluded) | Change |
|---|---|---|---|
Vardera | 96.0% | 94.1% | −1.9 pts |
Fable 5 | 64.0% | 30.6% | −33.4 pts |
Gemini 3.5 Flash | 54.4% | 19.5% | −34.9 pts |
GPT 5.6 | 53.3% | 21.4% | −31.9 pts |
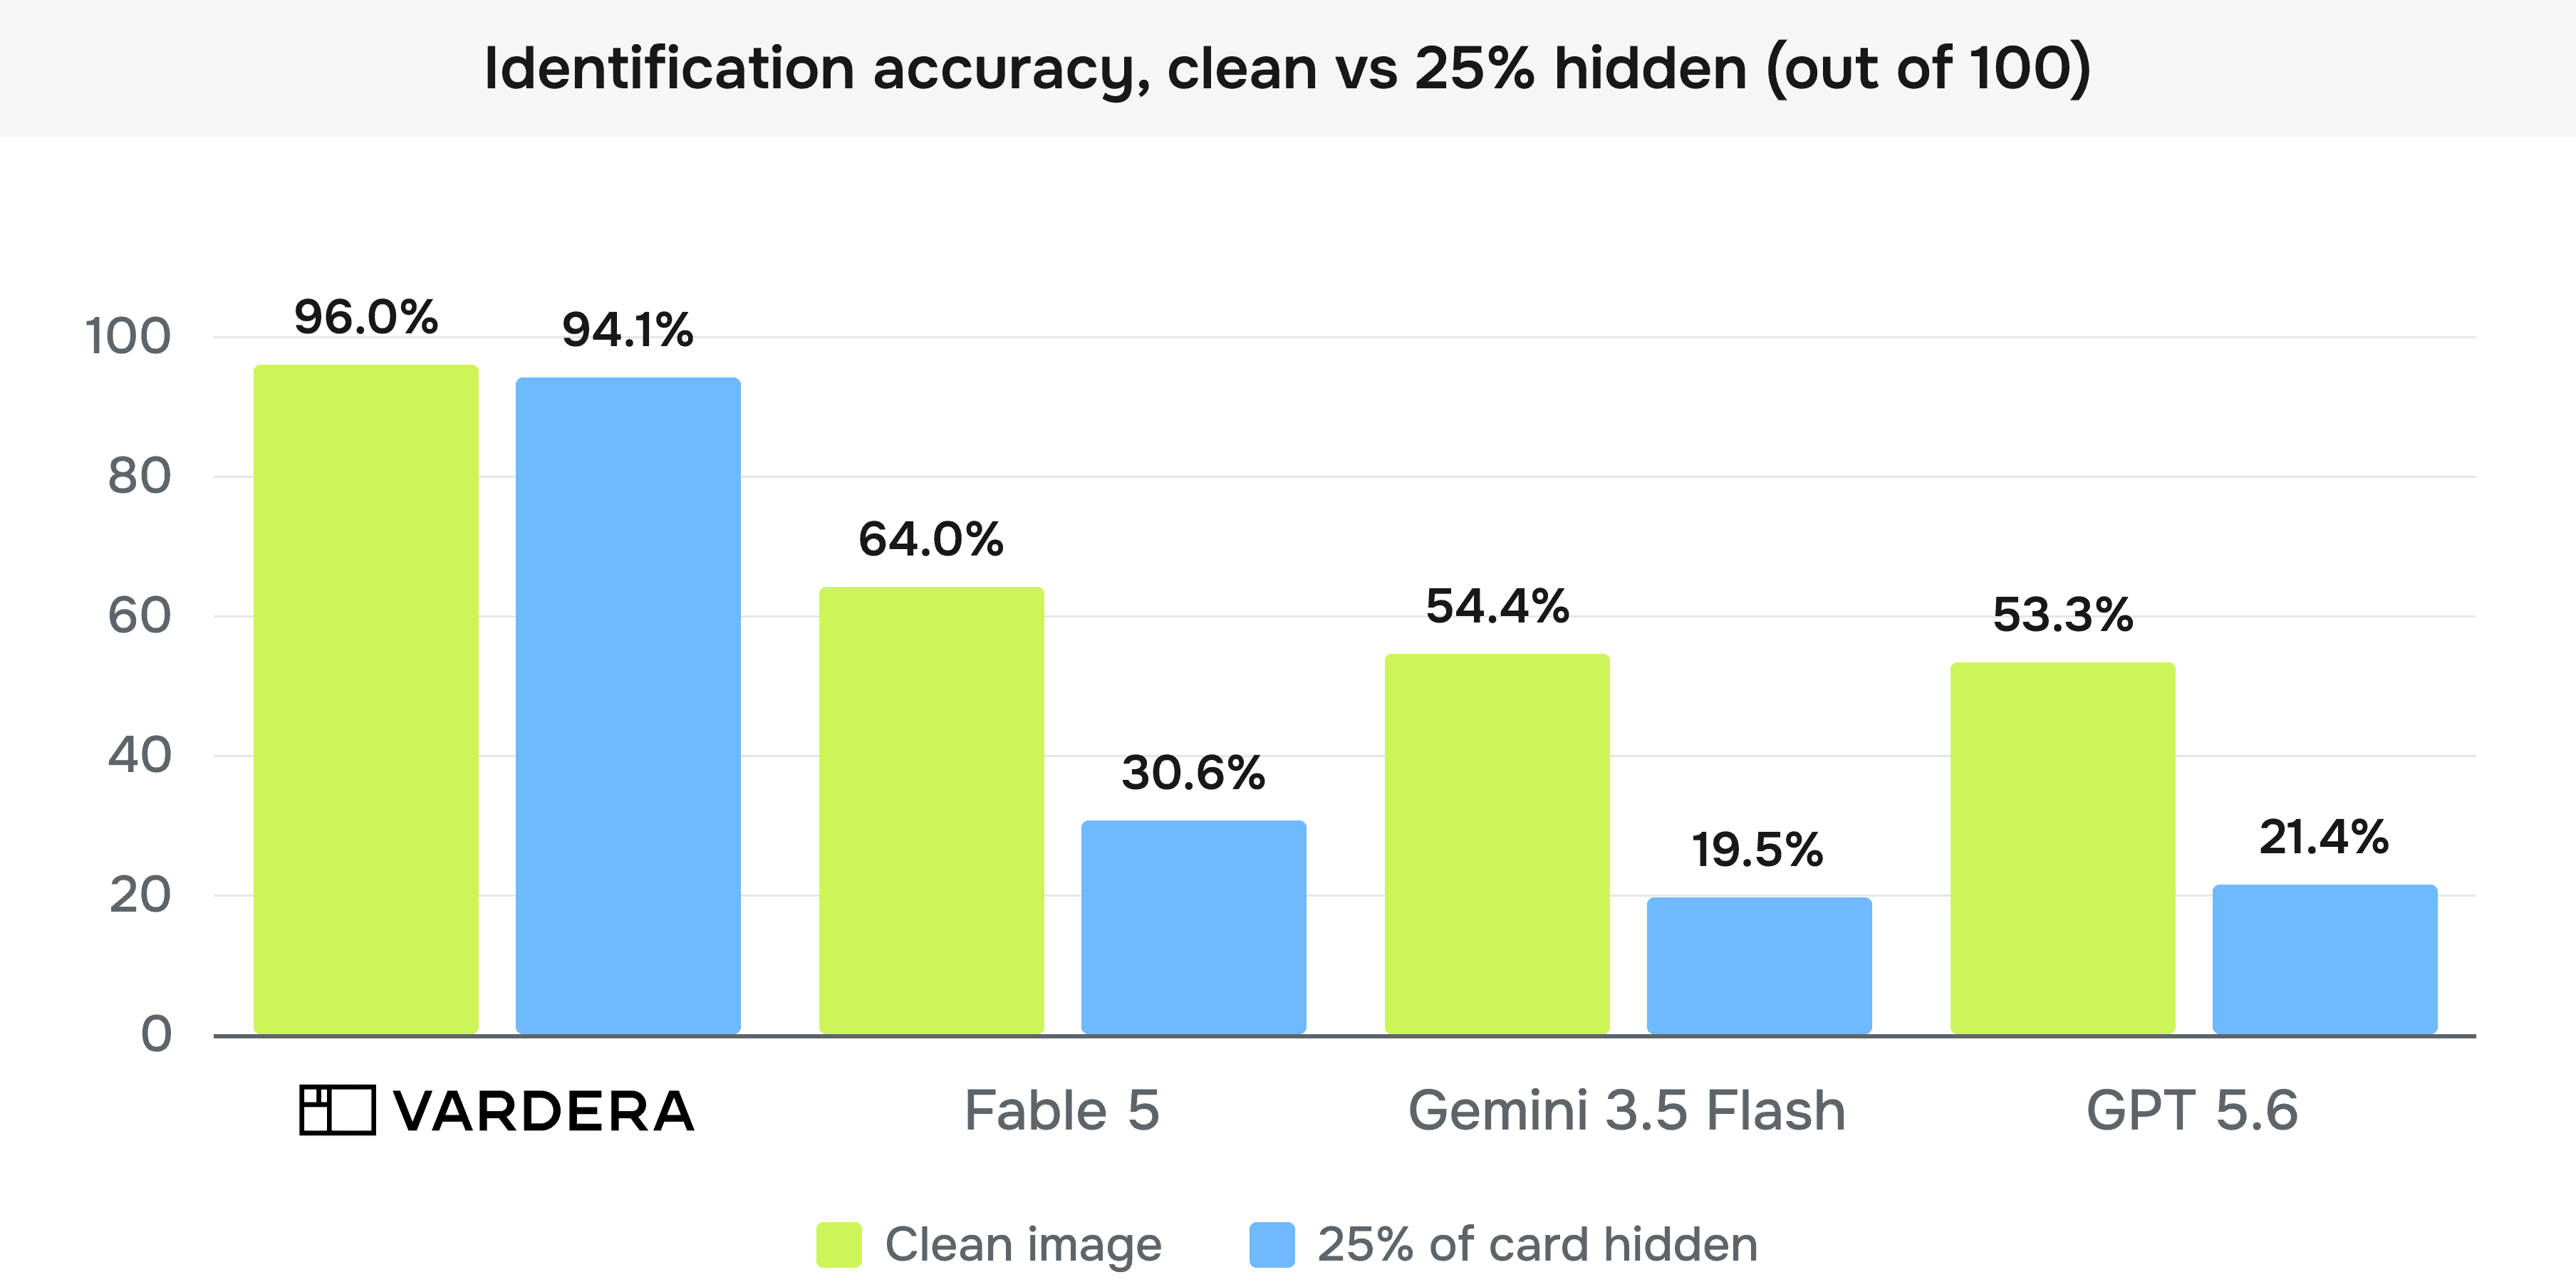
This result explains the whole benchmark. Frontier models identify cards by reading them — cover the name or the year and the guess falls apart. Vardera's models recognize the card itself, the way a lifelong collector recognizes a card across the room. Cover a quarter of it and the model still knows what it's looking at, because it was never just reading.
Grading honestly
Here is a fact about graded cards: most of them are nines. People grade cards that look nice. So a model that answers "9" every time scores 80 to 90% on a naturally distributed test set — while never catching a single damaged card. That's why headline grading accuracy alone — ours included — never tells the whole story, and why we report grading two ways.
Measured overall (every prediction counted equally), Vardera lands within one grade point 99% of the time; frontier models, 64 to 69%. But the honest measure is to score each grade separately — how well does the model grade the 3s, not just the 9s — and average those. On that class-balanced measure, Vardera scores 85%. The best frontier model scores 48%.²
Model | Within one grade (overall) | Within one grade (per grade class) |
|---|---|---|
Vardera | 98.9% | 85.0% |
Fable 5 | 69.4% | 48.0% |
Gemini 3.5 Flash | 64.2% | 43.6% |
GPT 5.6 | 66.7% | 32.4% |

The frontier models' generosity confirms the diagnosis: they overgrade by roughly 1.5 grade points on our deliberately balanced test set, because they've effectively learned what grade a card like this usually gets, not what condition this card is in. That's guessing the distribution. Grading is assessing the card in front of you — especially when it's a 3.
Right answer, wrong reasons: Subgrades
A grade is not one number. It is four judgments — centering, corners, edges, and surface — that resolve into the number on the slab. So we asked every model for all four, plus the overall grade, and checked whether the whole set held together on the same card.³
Getting the overall grade right is easy to fake. Call the corners a 3 and the edges a 5 when the truth is the reverse, and the average still lands on the right number. The grade is correct. The reasoning is nonsense. And on the next card, where the errors happen not to cancel, it is simply wrong.
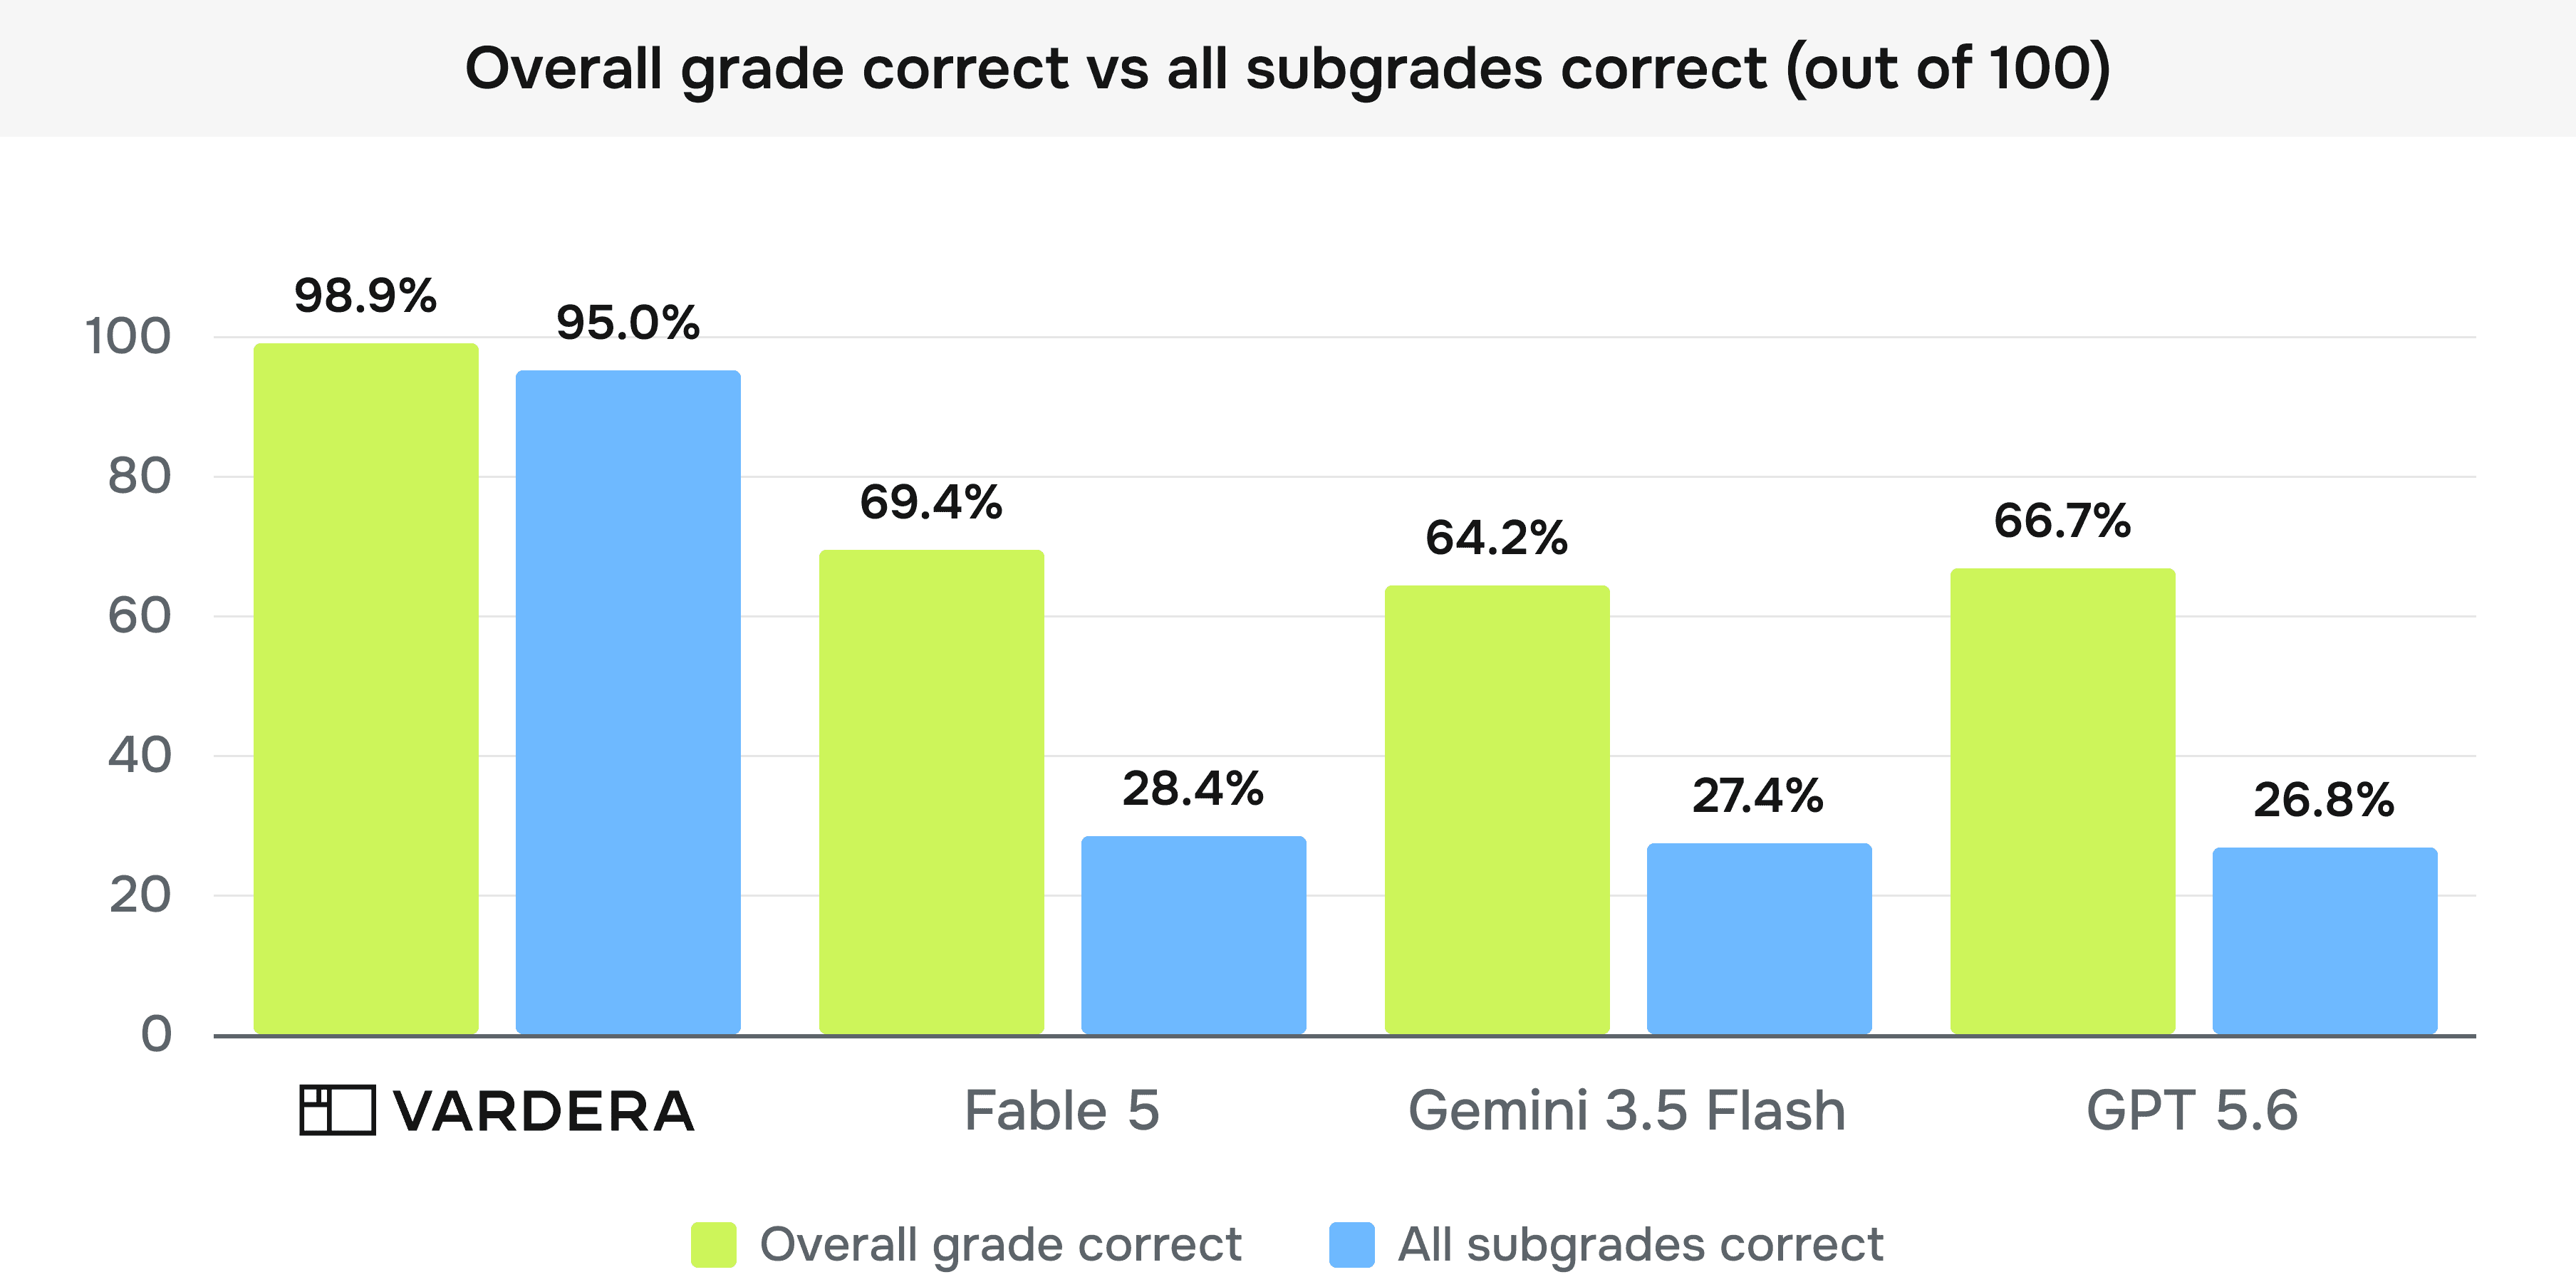
The distance between the two bars is the size of the luck. Fable 5 gets the overall grade right 69.4% of the time, and the complete set right 28.4% — a 41-point collapse. Gemini and GPT do the same thing. Work it through and roughly six out of every ten correct grades a frontier model produces are not correct assessments at all; they are averages that happened to work out.
Vardera goes from 98.9% to 95.0%. Just under four points, because our overall grade is derived from the subgrades rather than guessed alongside them.
That gap is the entire product for anyone who has to defend a number. A marketplace can absorb the occasional bad call. A grading body cannot hand a submitter a grade it is unable to explain, and neither can a trade-in counter telling someone their card is worth $40 rather than $400. Every grade Vardera returns arrives with the four measurements that produced it.
Pricing: A shot in the dark
Identification and grading determine what a card is. Pricing determines what it's worth — and here frontier models aren't estimating, they're improvising. They have no live sales data; prices moved after their training run ended. Asked for a card's market price, frontier models landed within 20% of actual comparable sales about 15% of the time, with a typical error of 60 to 65%. Ask the same model three times and you get three different prices more than 90% of the time. Bolting on web search doesn't fix it: it roughly triples the response time and the model still has to pick the right comps for the exact parallel and grade — the identification problem all over again.
Vardera's pricing model runs on identified spec, grade, and live sales data. Its typical error is 19.7% — roughly 3x more accurate than the best frontier model, accurate enough to anchor real listing, trade-in, and underwriting decisions, and it returns the same answer every time unless new market data changes it.
Live commerce? Too slow
Set accuracy aside. Frontier models averaged 8 to 12 seconds per card in our benchmark. An auction on Whatnot lasts about 10 seconds — by the time the model answers, the card has sold. A seller building a listing on eBay abandons a flow that stalls 10 seconds on every field. Real-time commerce needs answers in seconds, and needs them to be right. Vardera answers in under a second.
Conclusion
None of this is surprising if you understand how these systems are built. Frontier LLMs are trained on internet-scale text and image data to perform well across an enormous range of tasks. They read cards brilliantly. But they have no dedicated machinery for parallel disambiguation, no calibrated notion of centering or surface condition, and no grounding in the population and sales data that define what a card is and what it's worth. So they guess — fluently, confidently, and inconsistently.
Vardera's card models do nothing but cards. From the architecture, to training data, to evaluation metrics, everything is optimized for one job: looking at a card image and producing an accurate, explainable, repeatable identification, grade, and value. The result is not incremental improvement. It is a category difference in capability.
Nothing will ever be perfect at this. No model, and no human either. But scaling a card business means moving past a world where every meaningful transaction waits on an expert's eyes. We expect frontier models to keep improving on general vision tasks. The structural gap on fine-grained visual assessment is not something that closes with the next model release. It requires purpose-built training data, domain-specific architectures, and calibration against the standards the industry already trusts. That is what Vardera has built.
This is the second post in our benchmark series — coins were first, and more categories are coming. Our Trading Card API goes live in early September 2026, with beta access available now. If you're running a marketplace or platform where trading cards, coins, or other collectibles need to be accurately identified, graded, or valued at scale, we'd like to talk — reach out at info@vardera.com.
—
¹ The occlusion study was run as a separate experiment with its own clean-image baseline, so those baseline figures differ from the main benchmark by under 1.5 points.
² Overall ("micro") accuracy counts every prediction equally, so it rewards models on whatever grades are most common in the test set. The per-class ("macro") figure averages accuracy across each grade class separately, so a model can't score well by only being right about pristine cards. Frontier macro figures are macro recall at ±1 grade tolerance.
³ The subgrade comparison runs on a 190-card sample scored at ±1.0 tolerance per field, rather than the 800-card set used elsewhere in this post. "All subgrades correct" means the overall grade and all four subgrades are each within one point on the same run.
Written by
Ben Parfitt, Chief AI Officer
Want to see Vardera in action?